Post-process Stress Results (solver independent)
-
From the Contour panel, select the data type that should be used to calculate
the contours (for example: Displacement (v),
Stress (t), 1D stress,
Energy (s), etc.) from the Result type drop-down
menu.
The available result types change depending on the result file that is loaded.Tip: Click the expansion button
 to open the Choose From List dialog, where you can
filter result types for faster selection.
 -
Select a data component type from the second drop-down menu in the result type
section.
The list of available components is based on the selected result type. For example:
Result type Component options Displacement (v) Mag, X, Y, or Z. Stress (t) vonMises, Signed vonMises, P1(major), P2(mid), P3(minor), Pressure, MaxShear, Intensity, In-plane P1(major), In-plane P2(minor), XX, YY, ZZ, XY, YZ, or ZX. 1D stress Multiple options are listed for various elements such as: CELAS, CROD, CBAR, CBEAM, etc Energy (s) No component selection is necessary. -
If corner data is available, choose if a nodal or element value should be used
by checking/unchecking the Use corner data option (see
the element stress examples below).
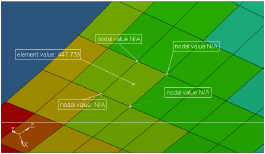
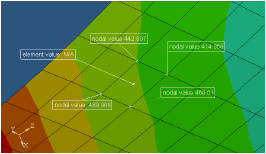
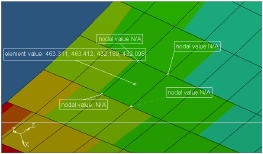
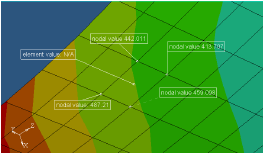
Averaging: None Averaging: Simple/Advanced Use corner data off One value per element: centroid value taken from result file. 
One nodal value for all corresponding elements: averaged from each centroid value. 
Use corner data on IP value mapped to nearest node, OR, Nodal result from result file (whichever of the two is available): values are not averaged at node. 
One nodal value for all corresponding elements: averaged using corresponding corner data values (either IP or nodal result from result file). 
- For Selection, pick one or more entities from the model.
-
Select the coordinate system that will be used to calculate the results from
the Resolved in drop-down menu.
Note: If User System is selected, use the System input collector to select a system by ID.
-
Use the Averaging method drop-down menu to select the
averaging type of the element contribution at the shared element node (see the
element stress examples below).
Only one element contoured: Averaging at nodes with values from that element.

Figure 1.Values that are averaged at nodes have contributions from all of the attached elements.
Figure 2. - Activate the Variation (%) check box and enter a percentage for the variation range.
- Activate the relevant check boxes for Display options, Legend threshold, and Result display control.
-
Click Apply to display the contour plot.
- For Abaqus .odb files
- The following results are available from *.odb
files:
- Centroid values
- Integration point values: S-Stress component or S-Stress component IP (Integration Points), depending on the result type.
- Nodal results: S-Stress component or S-Stress component IP (Integration Points), depending on the result type.

Averaging: None Averaging: Simple/Advanced Use corner data off One value per element: centroid value taken from result file. One nodal value for all corresponding elements: averaged from each centroid value. Use corner data on IP value mapped to nearest node
(S-Stress Components IP)
OR
Nodal result from result file
(S-Stress Component)
In both cases, values are not averaged at node.
One nodal value for all corresponding elements averaged using corresponding corner data values:
IP value (S-Stress Component IP)
OR
Nodal result (S-Stress Component) from the result file.
- For *.op2 and *.h3d results

- SHELL elements Solver output default - values are available at the
centroid:
- Use corner data option is not available.
- Averaging can be done on centroidal results (None, Simple, or Advanced).
- When CORNER, BILIN, or CUBIC have been called in the solver - nodal
results will be available in the result file for each element:
- Use Corner Data option is available.
- Corner data = nodal results are taken directly from the result file.
- Averaging can be done in Altair HyperView on the values taken from the result file.