CFD Post-Processing

HyperView offers CFD post-processing capabilities for a large class of industrial applications.

CFD results from AcuSolve can be loaded into HyperView via the native AcuSolve result reader (*.log file) or by using the Ensight reader. When using the Ensight reader, use AcuTrans to convert the AcuSolve results into the Ensight format.

The direct Ensight reader in HyperView allows you to import results from all major CFD solvers.

The following functionalities are available for CFD post-processing:
  • Streamlines
  • Contour
  • Iso Value
  • Vector Plot

Creating a Contour on a Cross Section

  1. From the Section Cut panel, apply a section cut to the model.
  2. Go to the Contour panel.
  3. From the Result type drop-down menu, select the data type that should be used to calculate the contours.
  4. Select the data component from the second drop-down menu below Result type.
  5. Select the section, or sections, that you want to contour.
    • If there are several sections displayed and you only want to contour just one section, select Elements for Selection, and pick one or more elements on the cross section of the model.
    • If you want to contour all of the sections displayed, click Apply (see Step #7 below).
  6. Activate the relevant check boxes for Display options, Legend threshold, and Result display control.
  7. Click Apply.
    The contour settings are applied to the cross section of the model.
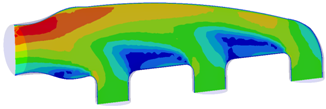

    Figure 1.
  8. Use the Graphical Manipulator to modify the definition of section cuts, as well as translate or rotate sections anywhere in 3-D space.
    Note: The graphical manipulator is linked to the entity display, therefore if a section cut is not displayed, the display of the graphical manipulator is also turned off. Right-click and select Show Manipulator to display the graphical manipulator in the modeling window.

Creating Iso Surfaces and a Contour Plot with Different Result Types

  1. From the Load Model panel, load a 3D model.
  2. Go to the Iso panel.
  3. From the Result type drop-down menu, select the data type that should be used to calculate the iso values (for example, pressure).
  4. Select the data component from the second drop-down menu below Result type.
  5. Click Apply.
    The model is displayed in iso value mode.
  6. Enter a value in the Current value text box or use the slider bar to display a specific value.
  7. Change the value in the Increment by text box to adjust the slider bar movement.
  8. Select an option for Show values to display elements based on result values which are above, equal, or below the threshold.
  9. Next, go to the Contour panel.
  10. From the Result type drop-down menu, select the data type that should be used to calculate the contours (for example, flow speed).
  11. Select the data component from the second drop-down menu below Result type.
  12. Click Apply.
    The contour plot is displayed on the specified iso surface section of the model.
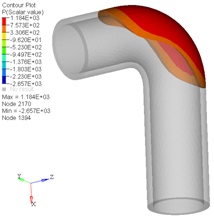

    Figure 2.

Creating a Vector Plot on a Cross Section

  1. From the Section Cut panel, apply a section cut to the model.
  2. Go to the Vector panel.
  3. From the Result type drop-down menu, select the name of the data type that should be used to calculate the vector plot (typically it is velocity).
    Note: Only data types with a vector format are available for you to choose.
  4. Under Selection, select the Sections option from the input collector drop-down menu.
  5. Pick a section.
    • Click on the Sections input collector and use the extended entity selection menu to select your desired section.
    • Pick a section directly on the model in the modeling window.
  6. Under Resolved in, verify that Global System is selected.
    Note: There is an interlock between the Resolved in system and the Advanced Options (Projected and Evenly Distributed).
  7. Optional: For Component, select the X, Y, or Z coordinates from the Plot tab (located in the middle of the panel), if necessary.
  8. For planar section cuts, click the Section tab and select your desired advanced options (advanced options are not currently supported for deformable section cuts):
    Option Description
    Projected Activate the check box to project the vectors to the cross section plane.
    Evenly distributed Activate the check box to evenly distribute the vectors on a cross section by specifying the number of rows and columns (see below).
    Note: Only first order solid elements on the model are supported by this option (second order elements on the model, parts of shells, and 1D elements are currently not supported).
    Number of rows/Number of columns Enter the number of rows and columns that will be used to evenly distribute the vectors on a cross section.
    Note: The Evenly distributed option must be activated in order to enable the number or rows/columns options.
  9. Click Apply.
    The vector settings are applied to the selected section on the model.


    Figure 3.
  10. Use the Graphical Manipulator to modify the definition of section cuts, as well as translate or rotate sections anywhere in 3-D space.
    Note: The graphical manipulator is linked to the entity display, therefore if a section cut is not displayed, the display of the graphical manipulator is also turned off. Right-click and select Show Manipulator to display the graphical manipulator in the modeling window.