Stress Linearization
Stress linearization, a widely used procedure in the Oil and Gas and ship-building industries, is used to analyze stresses in a structure, such as a pressure vessel.
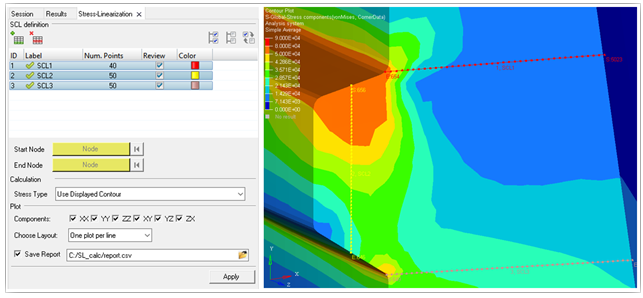
Figure 1.
- The stress is extracted by interpolation in a local coordinate system at all the points along the line. The local coordinate system is based on the start and end nodes of the SCL. See additional remarks for details.
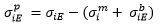
- From the extracted stress values in step 1, the average membrane stress tensor and
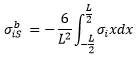
bending stress tensors at the start and end nodes are calculated using numerical
integration.
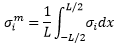

 = ith component
of membrane stress
= ith component
of membrane stress = ith component
of extracted stress value
= ith component
of extracted stress value = ith component
of bending stress at the start node
= ith component
of bending stress at the start node = ith component
of bending stress at the end node
= ith component
of bending stress at the end nodeL = Length of the SCL line
x represents the position of a point along the line
- Peak stresses and membrane + bending stresses are also calculated at the start and end
nodes.
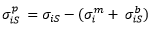
 = ith component
of peak stress at the start node
= ith component
of peak stress at the start node = ith component
of peak stress at the start node
= ith component
of peak stress at the start node - Finally, invariants for the membrane, membrane + bending and peak stresses are calculated.
Calculations can be done on one or more stress classification lines at a time. The results can be viewed as a HyperGraph plot or exported to a comma separated values (*.csv) file.
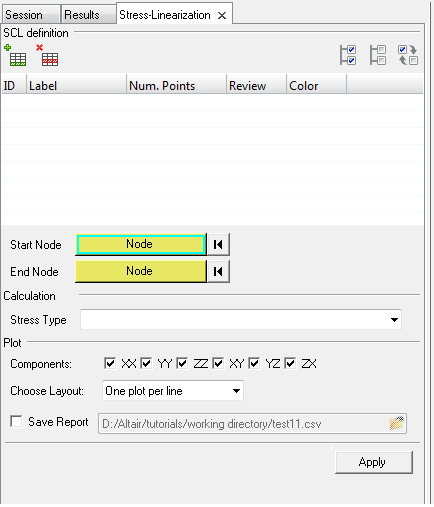
Figure 2.
The Stress-Linearization tool is displayed in the tab area and is broken down into three sections, each of which corresponds with the process order of using the tool.
SCL definition
Allows you to create and manage the line definitions. Stress classification lines (SCL) can be created by adding lines and picking start and end nodes.Line properties such as the number of points and color can also be set once the line is defined. A Review option is available to view the line in the modeling window.
Calculation
Allows you to choose the result type that will be used for stress linearization calculation. You can pick either the base stress tensor results from the result file or use the displayed contour that is available.Plot
Allows you to set which stress components from the calculation will be plotted in a separate HyperGraph window. The layout of the plot windows can also be set. In addition, an option is available to export the calculation as a report to a comma separated file (.csv).Comments
- Stress linearization is supported only on solid elements and the file must contain stress tensor results on these elements.
- Stress linearization calculations are performed at the simulation step at which the Apply button is clicked. Therefore even if the SCL was defined in another step, when applied, the line is updated per the location of the start and end nodes at the current step.
- Calculations cannot be performed if some points are not on the model or on solid
elements. A message dialog will display and the line will have to be re-defined.
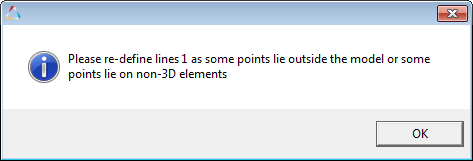
Figure 3. - The stresses are reported in a local coordinate system based on the line definition. The
X-axis of the system is along the line direction from N1 to N2. The other two axes are
calculated as follows:
- If the local x-axis is not parallel to global y-axis:
Zlocal = Xlocal x Yglobal
Ylocal = Zlocal x Xlocal
- If the local x-axis is parallel to global y-axis:
local y-axis (Ylocal) is negative of global-x if local-x is along positive global-y and vice versa.
Zlocal = Xlocal x Ylocal
- If the local x-axis is not parallel to global y-axis:
- There is no live link between the HyperGraph plot and the HyperView window from which it is generated.
- The report for each line is automatically appended to the .csv file.