Curves View
The Curves view, ![]() , displays the session's curves in the Plot Browser's tree structure, grouped within their respective page
and plot folders.
, displays the session's curves in the Plot Browser's tree structure, grouped within their respective page
and plot folders.
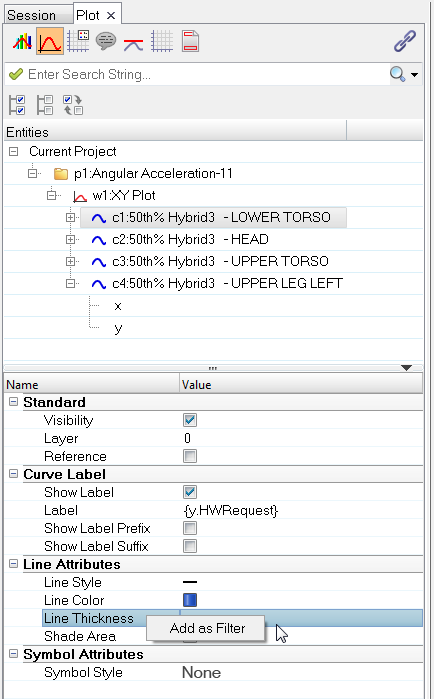
To apply a filter on a curve or on an x or y vector property, right-click on the curve or x/y vector’s property in the Properties Table and select Add as filter.
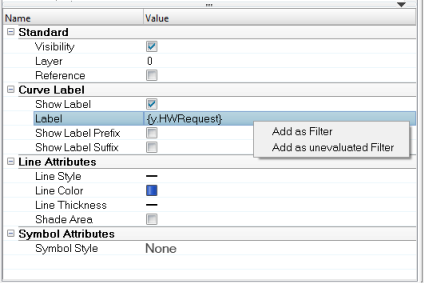
All text fields which support Templex have now two add filter options, Add as Filter and Add as unevaluated Filter. This allows you to add the unevaluated Templex code as a filter.
After a value is given to that filter, all curves or vectors with that value for that property are shown in the browser. Vectors are displayed with their corresponding curves. See Plot Browser Filter for more information.
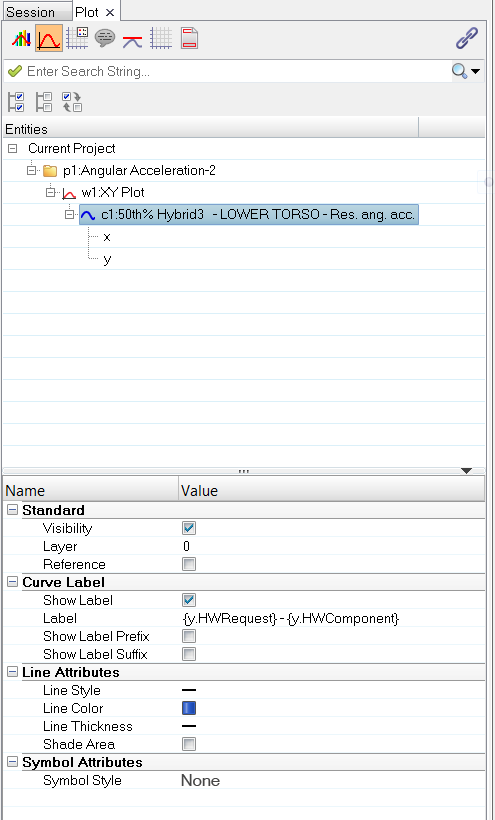
Vectors are shown in the Plot Browser tree as items under their corresponding curves. Clicking on a curve displays the curve's properties in the Properties Table; clicking on a vector displays the vector's properties in the Properties Table.
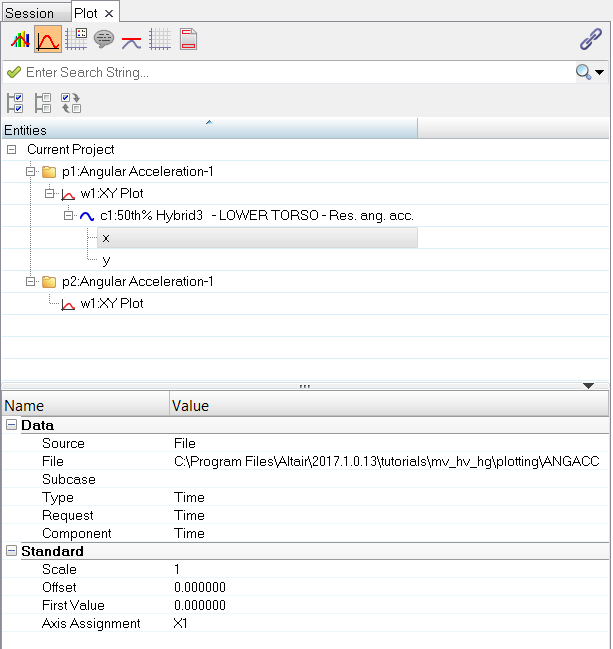
The following curve and vector (entity type) properties are visible and editable through the Properties Table.
Curve Properties
- Visibility, Layer, and Reference
- Curve Label Information (Show Label, Label Prefix, and Label Suffix)
- Line/Bar Style, Line Color, and Line Thickness
- Shade Area
- Symbol Style, Color, and Frequency
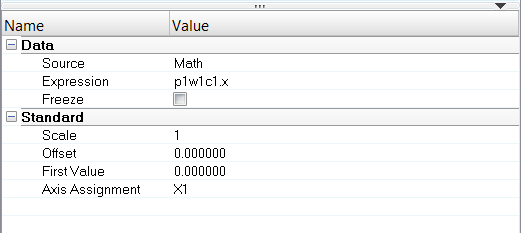
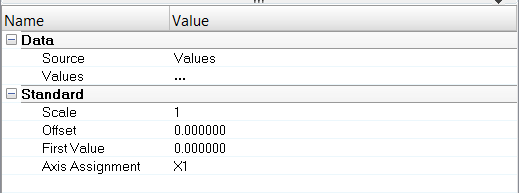
Vector (Entity Type) Properties
- Source
- File
- Freeze - Vectors can be frozen so that the HyperGraph does not recalculate the curve. When a vector is frozen, it is no longer dependent on a referenced curve, so changes made to other curves are not reflected in the frozen vector. Vectors can be unfrozen, making them once again subject to change. The X and Y vectors can be frozen independently of each other or together, freezing the entire curve. Frozen vectors are saved as data point values in session files.
- Expression
- Subcase
- Type
- Request
- Component
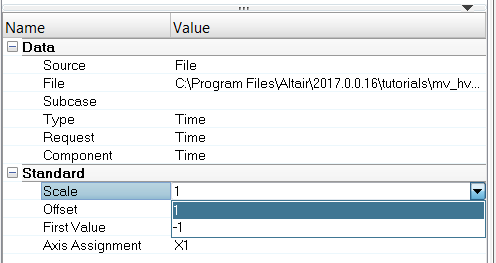
- Scale
- Offset
- First Value
- Axis Assignment
You can also select a curve from the Plot Browserand delete it by pressing the Delete keyboard key.
From the Scale drop-down menu in the Properties Table, the values 1 and -1 are the only options allowed for vector scaling if units are enabled.