Plot Browser
The HyperGraph 2D Plot Browser resides on a tab in the tab area sidebar and allows you to view the HyperGraph 2D plot structure.
The Plot Browser tools allow you to search, display, and edit
entities and their properties within the current session. The plot structure is
viewed as a flat, listed tree structure within the browser. However, if the plot has
a hierarchy, then the Plot Browser accommodates this
hierarchical structure. From the Plot Browser, you can select
entities one at a time or several simultaneously using common selection techniques.
You can also use the Plot Browser's context-sensitive menus to
select entities. You can use the Plot Browser to perform many of
the operations available in the HyperGraph 2D panels, thus allowing
you to modify your plot and curve properties in one location. Some of these
operations include:
- Performing single curve math and multiple curve math operations
- Renaming curves
- Modifying or deleting curve properties, such as:
- Curve attributes
- Axes attributes
- Plot options
- Notes
- Datum lines
- Plot macros
The Plot Browser can be turned on or off using the menu options. A check mark indicates that the HyperGraph 2D
Plot Browser is activated for display in the tab area.
Note: The
Plot Browser can also be positioned to appear on the
right side of the page (the right tab area).
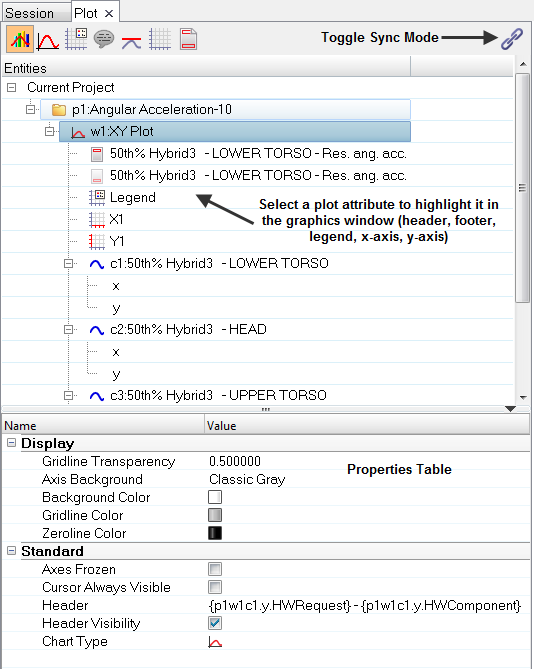
Figure 1. HyperGraph 2D Plot Browser with the Plots view selected
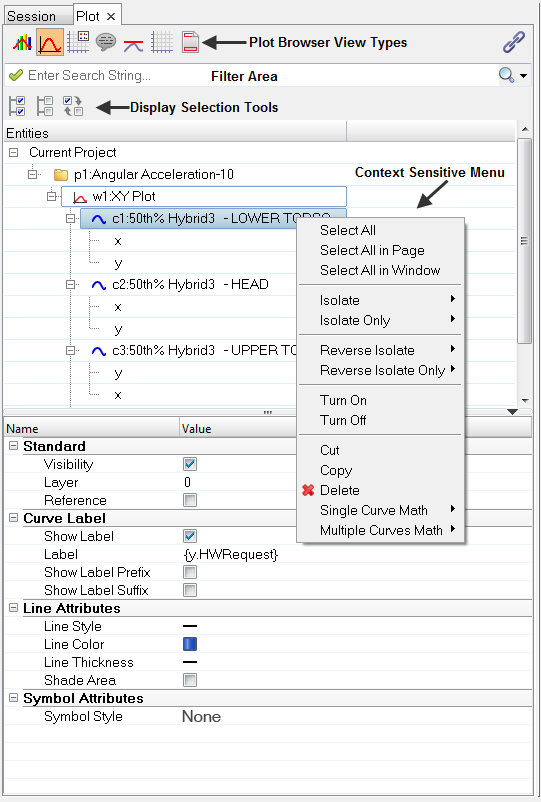
Figure 2. HyperGraph 2D Plot Browser with the Curves view selected
The following buttons can be used to change the display state of various entities in the plot browser tree.
 Select All
- Selects all entities shown in the tree.
 Select None
- Clears all entity selections shown in the tree.
 Reverse Selection
- Reverses the state of the items in the tree (displays the hidden and hides the displayed).