Axes View
The Axes View, ![]() , displays only the axes in the session, grouped within
their respective page and plot folders. Clicking on an axis displays the axis'
properties in the Properties Table.
, displays only the axes in the session, grouped within
their respective page and plot folders. Clicking on an axis displays the axis'
properties in the Properties Table.
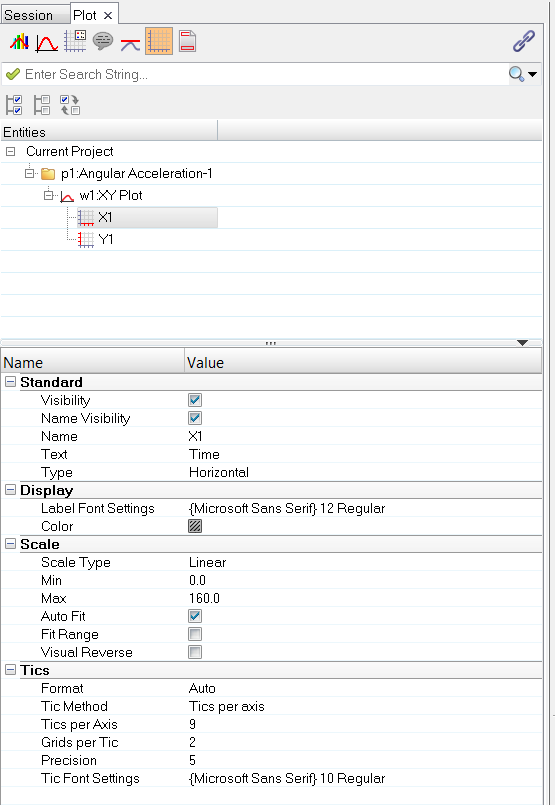
Figure 1.
When an axis is selected, the following fields are displayed in the Properties Table:
- Standard
- Visibility - select this option to display the axis in the plot window.
- Display
- Font settings and color.
- Scale
- Scale type
- Tics
- See the Scaling Axes and Axis Tics sections in the Axes topic for more information on the features in the Tic section.