Parallel Coordinate Post Processing
Visualize data trends.
Visualize Data Trends
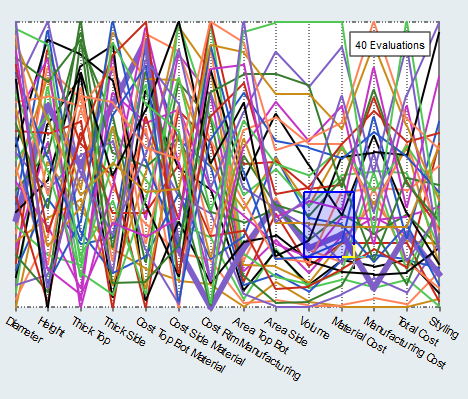
Visualize all run data across multiple channels on a single plot in the Parallel Coordinate post processing tab.
A parallel coordinate plot is also known as a snake plot.
-
Analyze run data.
Option Description Display evaluation index and run data Hover over a run line. The evaluation index and additional run data is displayed as tooltips.
Highlight run line Left-click a run line in the plot. or
Click Show Table (located above the Channel selector) to open the Parallel Coordinate Table dialog. Each run displayed in the plot is represented in a table row. Select the rows which contain the run to highlight in the plot.Note: Highlighting is disabled when a large number of runs is displayed.Tip: The Show Table option enables you to control the table channels independent of the plotted channels.This can be useful, for example, if you are plotting objective or constraint values and want to only see the variables that correspond to them.
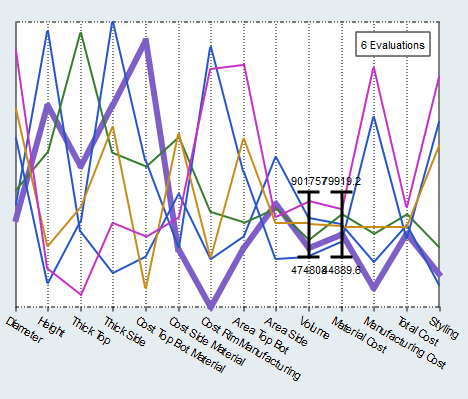
Review trends in run data Click-and-drag your mouse to draw boxes around sets of lines. All of the lines included in the box remain displayed, while unselected lines disappear. A visual indicator appears, and displays the minimum and maximum values for the selected set of lines.
Multiple boxes can be drawn around sets of line to review.
To display all of the lines, right-click in the plot and select Reset Filter from the context menu.
Filter run data Click Show Filter (located above the Channel selector) to open the Coordinate Filter dialog. - From the Filter column, select the input variables and output responses to plot.
- From the Filter Min and Filter Max columns, enter values to filter.
Parallel Coordinate Tab Settings
Settings to configure the parallel coordinate plots displayed in the Ordination post processing tab.
- Absolute Scale
- Enable an absolute scale versus a relative scale which is used by default.
- Show min/max
- Turn the display of min and max ranges on and off.