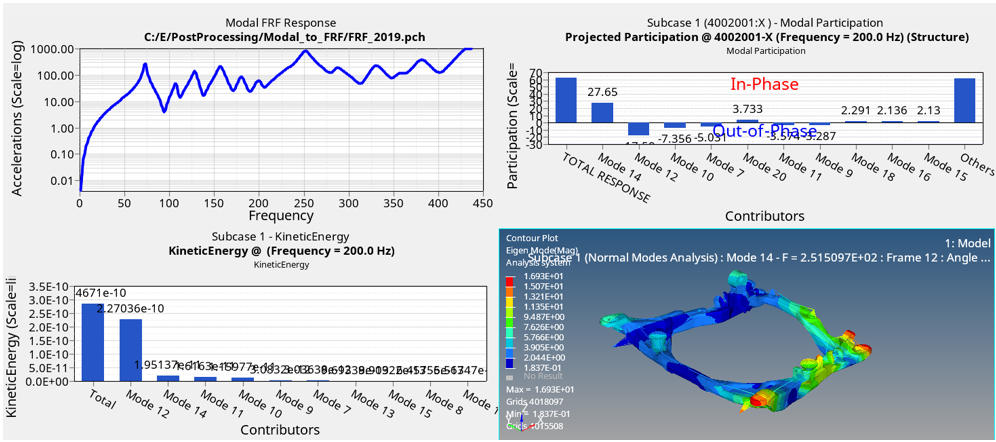
Modal FRF - Plot Diagnostics
Plot the diagnostics.
- Bar
- Creates a bar plot of the diagnostic results at a specific frequency.
- Show highest contrib
- Select the highest number of contributors to display.
- Diagnostic Type
- Select the diagnostic results calculated from the modal results.
- Display Options
- The Display Options dialog allows you to further customize the plot.
- Display
- Click Display to create and display the plot.

Figure 1.