Start of Necking Point
The Johnson-Cook model previously defined corresponds to the experimental results up to the necking point. However, the slope of the numerical response does not enable the necking point to start at the strain value observed experimentally.
Necking Point Simulation
The necking point is characterized by the slope value of the true stress versus the true strain curve, which must be approximately equal to the true stress. The necking point numerically appears by continuing simulation until the condition on the slope is observed.

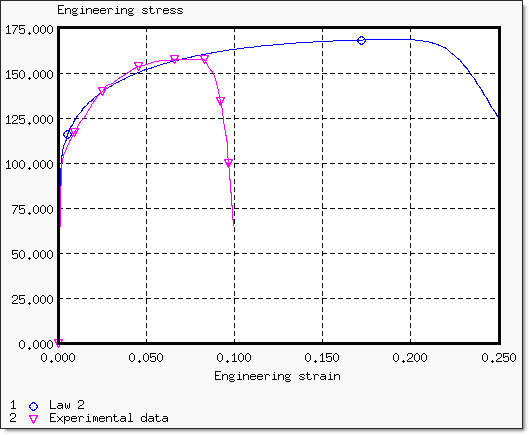
Figure 1. Beginning of the Necking Point using only the first coefficients of the Johnson-Cook model (a, b and n)

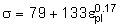
Figure 2. True Stress versus True Strain Curve up to the Beginning of the Necking Point
The necking point can be simulated, either by adjusting the Johnson-Cook coefficients to obtain an accurate slope, or by compelling curve with a maximum stress.
Slope Near Necking Point Simulation
By implementing an energy approach, the hardening curve can be modified to achieve an engineering curve which resembles a horizontal asymptote near the necking point with the purpose of simulating the behavior of the curve as observed in the test.
- Yield stress
- 79
- Hardening parameter
- 133
- Hardening exponent
- 0.17
The results obtained with those coefficients are provided below.
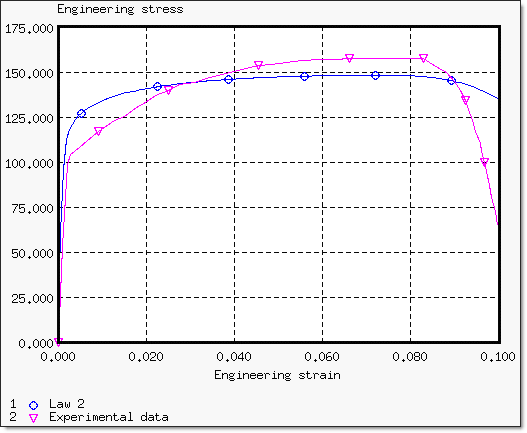
Figure 3. Adjusted Engineering Stress/Strain Curve to Model the Beginning of the Necking Point

Figure 4. Yield Curves

Figure 5. Superposition of Engineering Curve and True Curve with its Derivate
Start of Necking Point using Maximum Stress Limit
For this test, the Johnson-Cook coefficients input are those set in characterization up to the necking point, the failure effect not being taken into account (the failure plastic strain is set to zero). The beginning of the necking point is set using the choice of a maximum stress value. In comparison to the experimental results (Figure 2), the necking point is well defined for a maximum stress set at 175 . The limit in stress appears on the von Mises stress versus true strain curve on elements where the necking point occurs.

Figure 6. Engineering Stress versus Engineering Strain; Necking Point Characterization
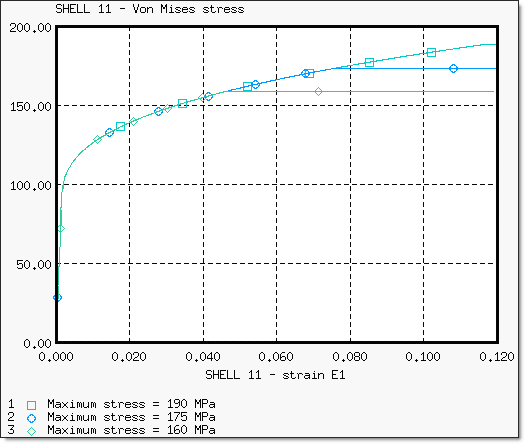
Figure 7. Variation of the von Mises Stress with the True Strain from Shell 11
Maximum stress is reached for von Mises stress on shells where the necking begins. To avoid overly-high stresses after the necking point, a maximum stress factor must be set approximately equal to the true necking point stress.
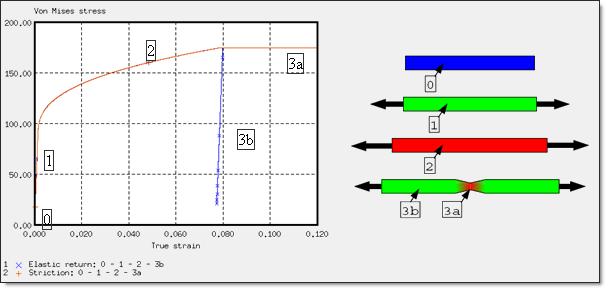
Figure 8. von Mises Stress Curve with a Maximum Stress Limit
 .
.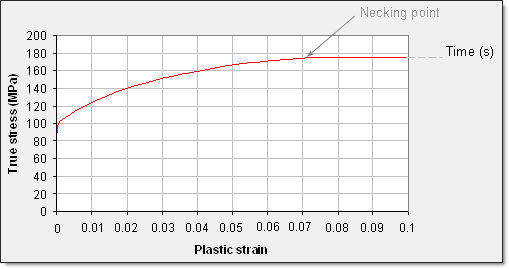
Figure 9. Yield Curve with Maximum Stress

The derivate of the stress is very sensitive and strongly depends on the yield curve definition. Thus, introducing the necking point into the simulation is very delicate (a small change can result in many variations). The necking point should first begin on a given element for numerical reasons.
Preferred Start of Necking Point
Experimentally, the beginning of the necking point can appear anywhere on the object. The beginning of the necking point should preferably be located on the right end elements in order to propose a methodology for this quasi-static test. If the model only uses a quarter part of the object, the necking point is found on elements 30, 125 and 78.
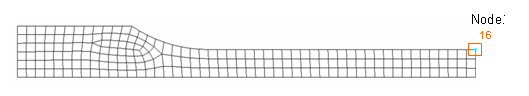
Figure 10. Node 16 to be Moved

Figure 11. Localization of the Beginning of the Necking Point According to the Models using
- = 174 / 175 MPa

Figure 12. Engineering Stress/Strain Curve for each Starting Necking Point Location
There is a fast decrease in the engineering stress after the right-end necking point. The necking point, due to the boundary conditions of the y-symmetry plane (y-translation DOF released), becomes more pronounced.
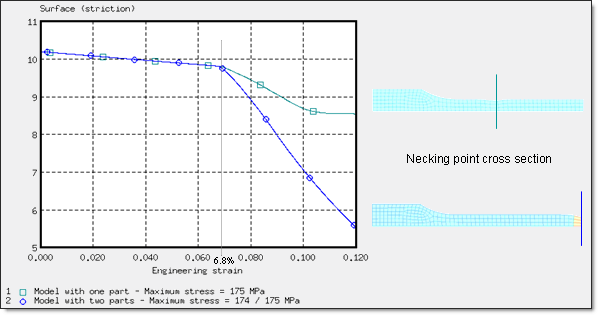
Figure 13. Variation of Cross Section (necking point zone)