In order to simulate physically the contribution of each element in the necking
point, it is advisable to adjust the curve by varying the Johnson-Cook coefficients
in order to increase the intensity of stress at the necking point. The main result
is no longer the variation of the stress/strain curve but rather the surface under
the curve which characterizes the energy dissipated during the test. This
energy-based approach is relevant for crash tests since the final assessment is
often more significant than how it was achieved.(1)
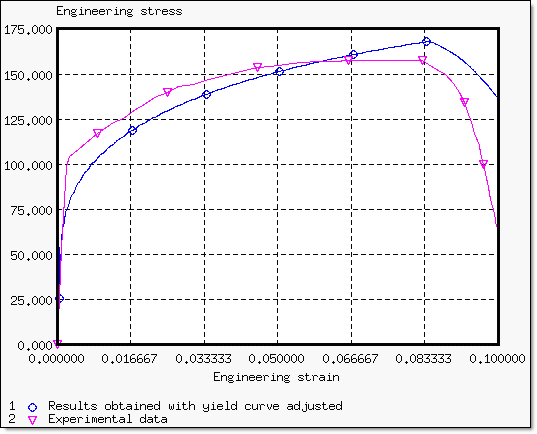
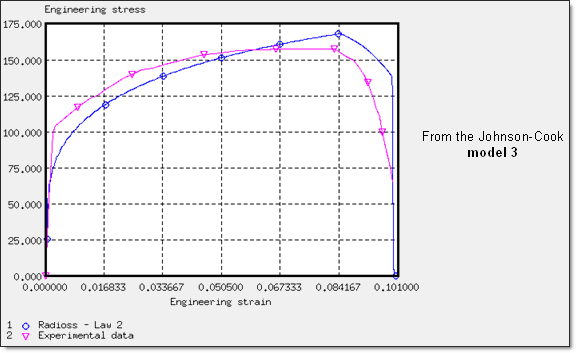
Figure 1. Engineering Stress/Strain Curve Obtained using Adjusted Johnson-Cook
Coefficients
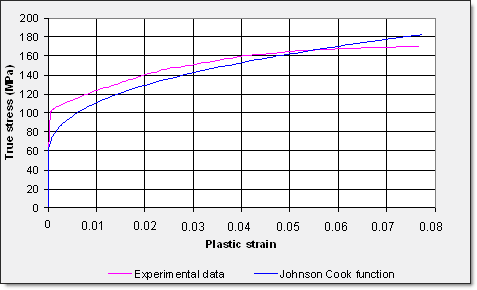
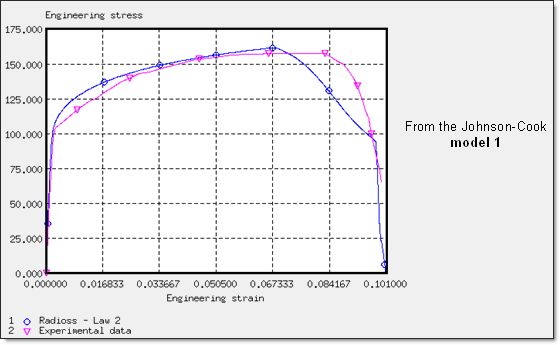
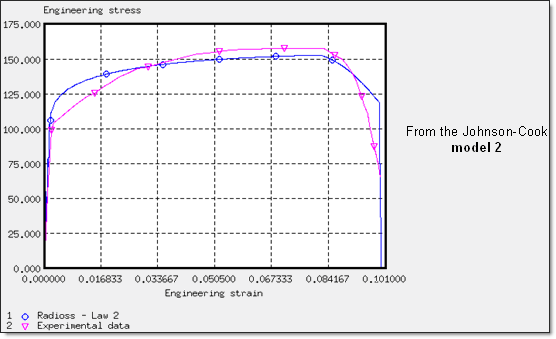
Figure 2 compares the new yield curve with
experimental data: Figure 2. Yield Curves
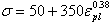
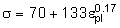
Material is described in the Johnson-Cook coefficients are (Model 3):(2)
Yield stress
50
Hardening parameter
350
Hardening exponent
0.38
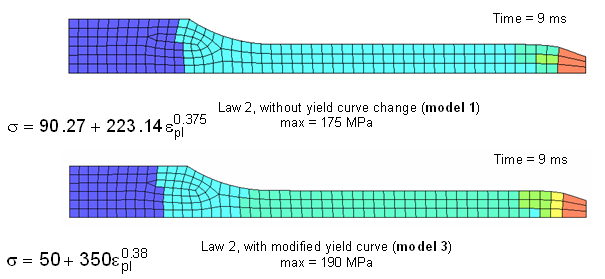
Maximum stress is set to 189 or 190 MPa (according to the parts).
The results of adjustment to the Johnson-Cook coefficients are: Figure 3. Shell Contribution during the Necking Point Sequence (von Mises
stress)
As the necking point progresses, more physical results are obtained due to the new
input data of the material law coefficients having a better element
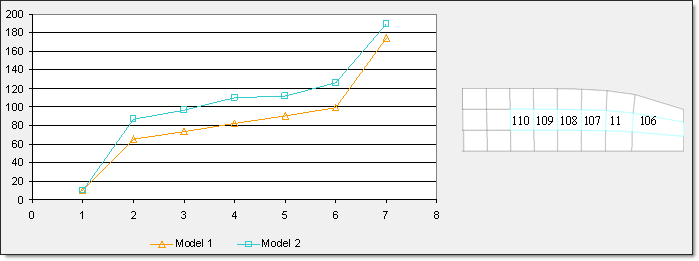
contribution. Figure 4. Variation of the von Mises Stress on Elements 110, 109, 108, 107, 11 and
106
Damage Modeling with Plastic Strain Failure
The elasto-plastic model of Johnson-Cook is used until failure, which is simulated
using a plastic strain failure option. The element is deleted if the plastic strain
reaches a user-defined value . This damage model shows good stability. A maximum plastic
strain is defined for each Johnson-Cook model: Figure 5. = 75% ; Yield Curve Close to Experimental Data:
Figure 6. = 47% ; Yield Curve Adjusted with Respect to Lower
Stresses: Figure 7. = 40% ; Yield Curve Adjusted with Respect to High
Stresses:
Failure is reached for relatively high true strains.