Curves
Use the Splines tool to create and edit curves.
Curves Overview
A curve consists of two or more column vectors that can be used either to create XY data (referred as 2D spline) or a line geometry in 3D modeling space (3D curve). The 2D spline can be used as reference input for other MotionView entities such as a force or motion. The 3D curve can be used for certain types of constraints such as a point-to-curve constraint.

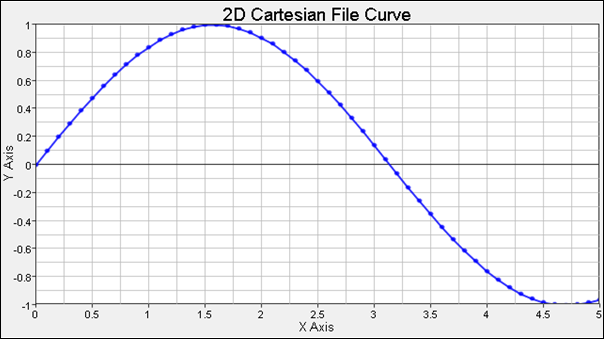
Figure 1.
Curves have many varies applications, some of which are listed below:
| Application | Description |
|---|---|
| Forces | Forces are used to define nonlinear characteristics for the forces. The curve may represent a spring force versus deformation characteristic or a damping force versus deformation velocity characteristic. This data is frequently measured experimentally. |
| Motions | Motions are used to define nonlinear displacements versus time, velocity versus time, and/or acceleration versus time |
| Vectors, Differential equations | Curves may be used to define relationships that are difficult to describe analytically. |
- 2D Curves
- 3D curves
Cartesian Curve
A Cartesian curve simply consists of two or more vectors that could be defined independent to each other, yet they should consist of same number of data points.
Paramteric Curve
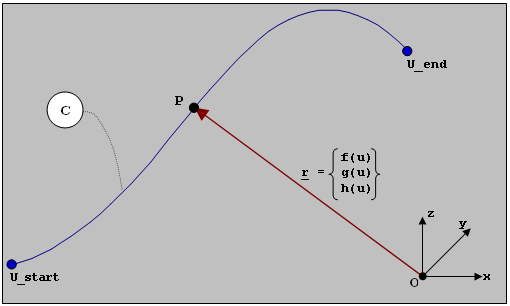
A parametric curve is defined in terms of one free parameter, u. Referring to the image below, assume a curve C is defined with respect to a coordinate system OXYZ. The coordinates of any arbitrary point on the curve P, as measured in OXYZ, can be represented uniquely in terms of the free parameter u with three functions, f(u), g(u), and h(u), that define the x-, y- and z-coordinates of P. The extent of the curve is governed by the start and end values of u. This is a parametric representation for a curve.

Figure 2.
A 2D parametric curve has three vectors – that is, one free parameter vector U, and two dependent vectors X and Y.
A 3D parametric curve has fours vectors – that is, one free parameter U, and three dependent vectors X, Y, and Z.
Create Curves
The Curves tool to create and edit curves.
Edit Curves
In MotionView, a curve entity is used to capture non-linear characteristics of forces and motion or to describe constraint paths for high-pair joint types. A 2D curve is used to represent the non-linear characteristics of forces or motion and a 3D curve can be created to use in a higher pair joint.
Define the Properties of Curves
From the Properties tab, you can define and edit the curve properties listed below.
- Click Show Curve to display a curve preview dialog.
- Click Export Curve to display the Export Curve dialog, which allows you yo export plot data in several different formats that can be read by other software applications.
Define the Attributes of Curves
From the Attribute tab, you can define the scale and offset for the X and Y vectors. When a data vector is scaled, the vector is multiplied by a specified value. The original data values are not actually altered. Offsetting a data vector shifts the data along the corresponding axis.
Define the Visualization of Curves
From the Visualization tab, you can define the way you want to display, or visualize, a curve.
- Click the Visualization tab.
- Activate the Extrapolate option and enter the percentage by which you want to extrapolate the curve.
- Activate the Interpolate option.
- From the drop-down menu, select a method to interpolate the curve:
- Click Show Curve to display the curve Preview dialog.
- Activate Symbols to place symbols on a curve to indicate data points.
Use User-Defined Properties for a Curve
If desired, define the curve using the User-Defined tab, which will allow you to specify the properties of the curve using user subroutines.
- From the Properties tab, click the User-defined check box.
- Click the newly added User-Defined tab.
-
Define the user subroutine.
Export a Curve
Plot data can be exported in several different formats that can be read by other software applications.