Define the Overlay Area and Save as a Report Template.
After defining the overlay area, save it as a report template.
-
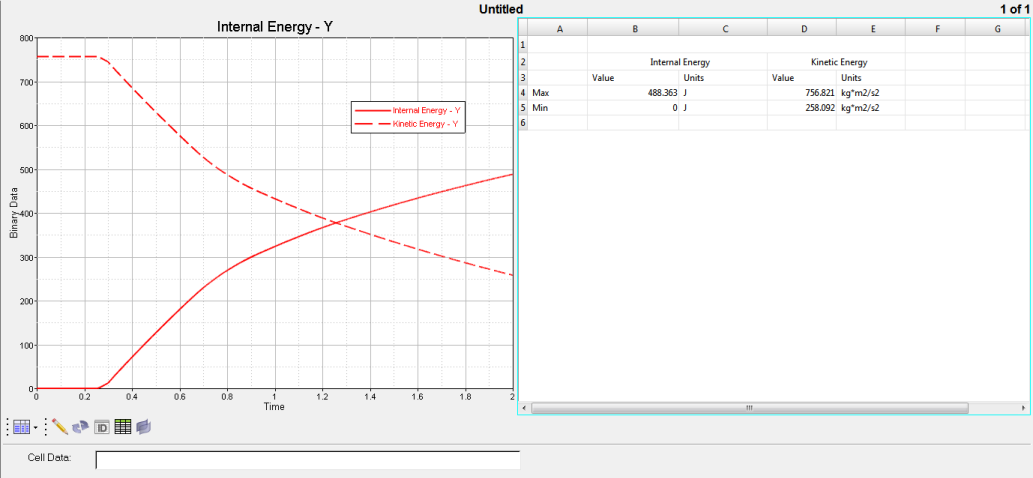
Create or load a session file that contains your data.
For example, the following session displays the internal and kinetic energy data in TableView (right side of image) for the curves shown on the left:
-
Click the selector icon, and with the left mouse button, drag and select the
cells in TableView that contain the previously loaded
data.
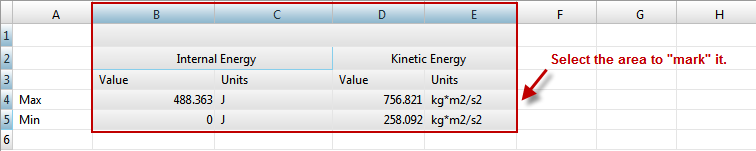

Figure 1. The cells you marked are displayed in the panel below: