Perform Model Checks
Perform various model checks in the Comparison Browser.
Offset
Offset is mainly used to offset surface to mid plane location and to convert the CAD files to .hm format.
-
Click the folder icon and navigate to the model to import (Folder/File
selections).
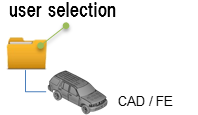
Figure 1.
Comparison
Comparison is used to compare two models using the Model Verification tool.
-
Click the folder icon and navigate to the model to import (Folder/File
selections).
Figure 2. -
Click the folder icon and navigate to the model to import (Folder/File
selections).
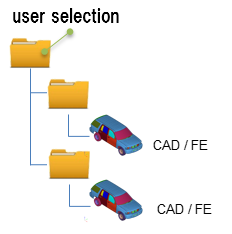 Figure 3.
 -
Click View Report to display the Summary PowerPoint
report.
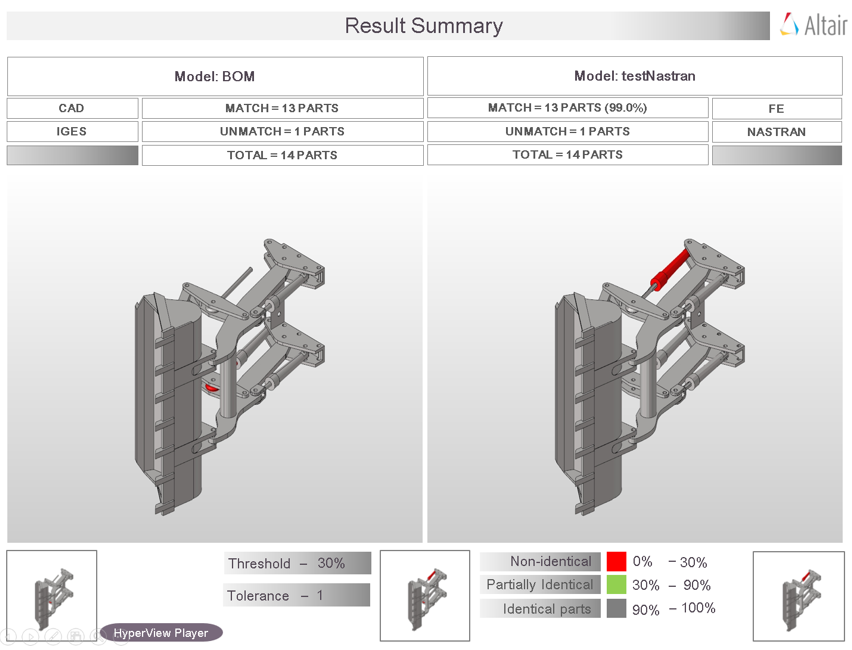
Figure 4. PowerPoint Summary . (Stored in Report Path)The slide shows the comparison between a source assembly and the target assembly. The left half of the image shows the source assembly and the right half of the image shows the target assembly. In the example illustrated above, the source assembly has a total of 39 parts. The target assembly has a total of 38 parts. The matching parts (between the source and target assemblies) are highlighted in black and the unmatched parts are shown in red.
The second slide shows the matched and unmatched results for individual parts, number of parts are limited to 40 which matches Excel report. This limitation can edited in configuration.
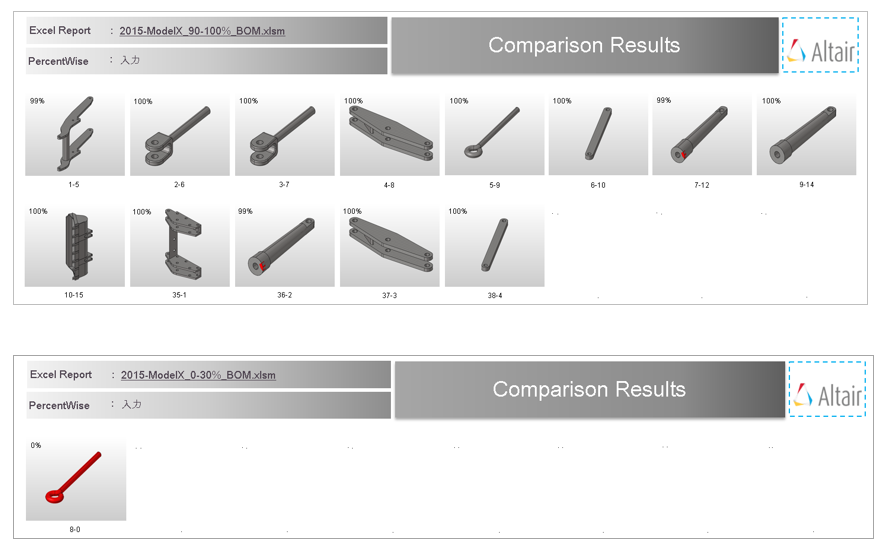
Figure 5. Matched and Unmatched Results. (from 2nd slide of Summary PowerPoint Report)
Output
Overview of the output generated from a Comparison check.
Excel
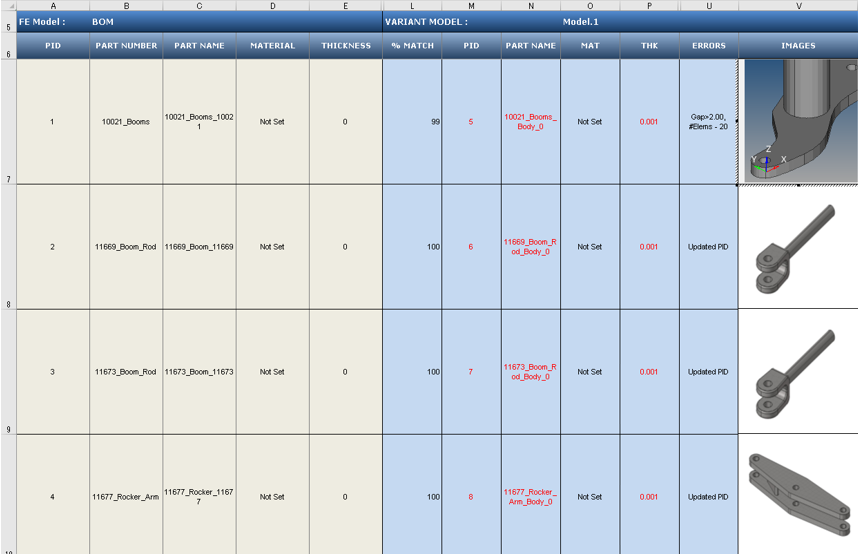
Figure 6.
- Base Model Input
- Input information about each of the parts of the CAD model that the tool uses for performing the a comparison check. The Base Model Input is the first assembly shown in the Part Browser, and can be cross checked at row 5.
- Variant Model Input
- Results of the comparison check. The match percentage column shows a part vise match percentage. If the value of match percentage for a part is 0 or less than the threshold percentage, then the part is said to be unmatched with the corresponding part of the other assembly. If the match percentage is above the threshold value, then the parts are considered matching. The error is reported in the error column. Variant model’s Material name or Thickness values are compared against Base model, mismatch values are shown in red text. Variant Model Input increases depending on the number of Variant model found in the Variant Input folder. Variant model name can be cross checked at row 5.
- Image Type
- Shortcut to the image the part.
- If the image type is JPG, then this shortcut opens the full sized image for viewing.
- If the image type is H3D, then the shortcut opens in the part in H3D format in a new HyperMesh window.
Comparison with Browser Selection
Compare CAD vs. CAD models, FE vs. FE models, and CAD vs. FE models with a Comparison check.
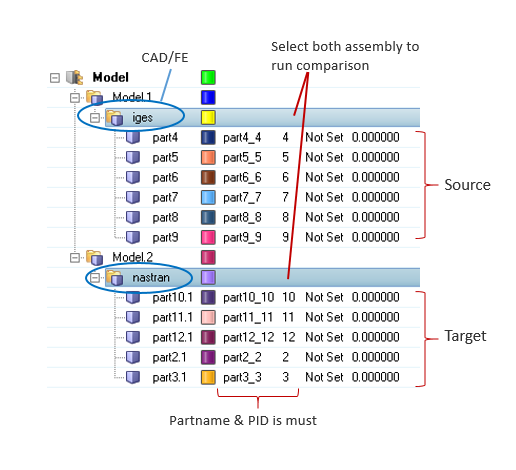
Figure 7. Import Data to Compare
- Comments
-
- During a Comparison check, the part files may get reloaded several times. Converting all models to the HyperMesh format can improve performance. It is recommended that you perform a No-Offset operation before starting the comparison process by selecting .
- During a Comparison check, the part files may get reloaded several times. It is recommended that all models be in HyperMesh format to improve performance. Use the Offset operation before performing a comparison.
- When generating reports, Excel or PowerPoint reports may open several times. It is recommended that you do not to launch or close any Microsoft Office application or use the keyboard during this operation.
- Translation or Smetry comparison runs using 1 CPU. A single CPU is automatically utilized, even when you manually set multiple CPUs.
- If more than one input model is found in the variant folder, a multiple model comparison is activated.
- The folder structure is to be maintained when organizing variant model files. CAD files must be managed under variant folders, and you must select the variant root folder. If the variant root contains more than one sub folder (variants), a multiple model (variant) comparison is activated.
Troubleshoot Model Verification Comparison Check Problems
Approaches used to troubleshoot Model Verification comparison check problems.
- The type of CAD files and the corresponding license required to import the CAD files into Model Verification.
- The tolerance value specified in the GUI (Thickness/2.0).
- Filters specified, such as those in the following list:
- Connection Name Filter
- Area Filter
- CG Filter
- Match % Filter
- Availability of license when using the multiple CPU option. The unit
requirement can be calculated using this formula:
40 + ((No. of CPUs
                            * 21) - 21)
Find which filter parts that are excluded from during comparison.
-
Select .
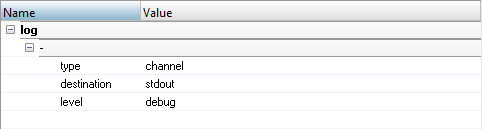
Figure 8. -
Check the Tk Console of the stdout files.
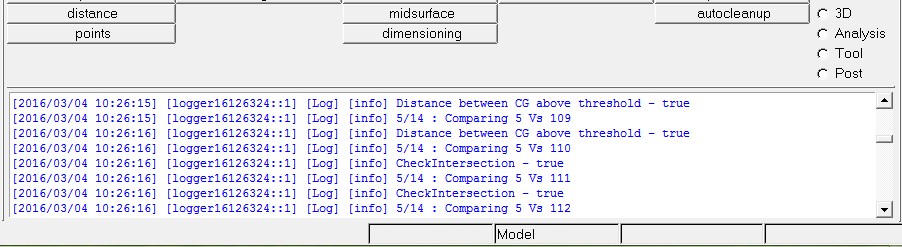
Figure 9.
Intersect
Intersect checks provide information in Power Point reports on all the inter-part intersection/overlapping in the CAD parts.
Once the model is done with the Intersection check, the tool locates the point of intersection as a cross-hair and summarizes all the intersections found in the PowerPoint report.
-
Click the folder icon and navigate to the model to import (Folder/File
selections).
The folder or the selected location must contain the spot weld file. The spot weld file type must be set in the config file.
Figure 10. -
Click View Report to display the Summary PowerPoint
report.
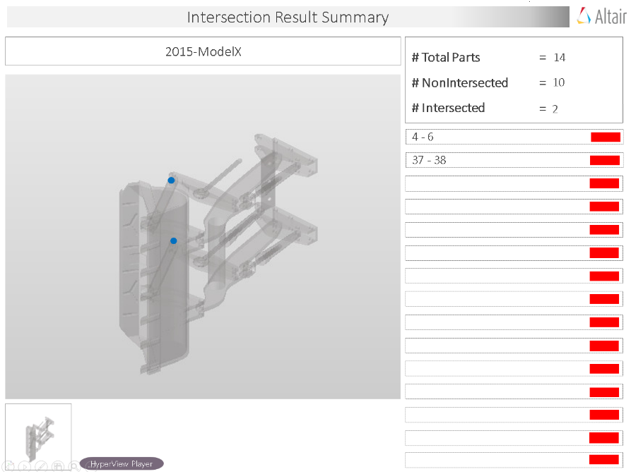
Figure 11. PowerPoint Summary . (Stored in Report Path)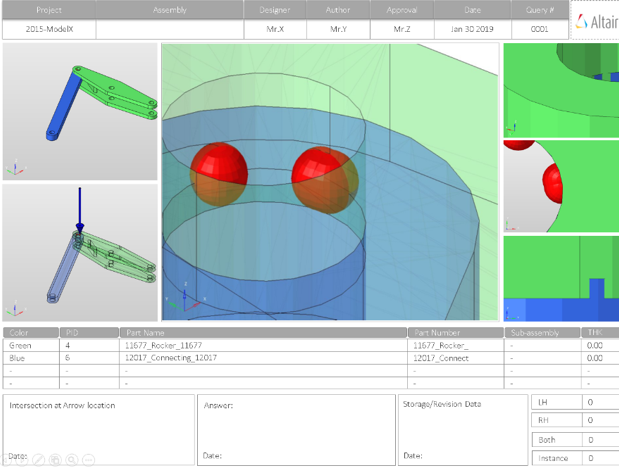
Figure 12. PowerPoint Detailed Report . (Stored in Report Path)
Output
Overview of the PowerPoint report generated from the Intersection check.
- Report Header
- Project name, assembly name, and slide number.
- Assembly Picture
- Image of the components that have intersection issues.
- H3D Image
- Section can be viewed in the HyperView Player, and shows the CAD model with the intersection marked with Cross Hairs.
- Issue Details
- Details of components which have intersection issues.
- User Review
- Add additional information when exchanging information with designers/engineers.
- Additional Info
- Occurrences of the issue shown in the current slide. The number of instances show the number of occurrences of the issue.
Spotweld
Spot Weld checks identify problems with spot welds in the model and shows them in the report.
The identified problems in spot welds are highlighted using a cross-hair in the images.
-
Click the folder icon and navigate to the model to import (Folder/File
selections).
The folder or the selected location must contain the spot weld file. The spot weld file type must be set in the config file.
Figure 13. -
Click View Report to display the Summary PowerPoint
report.

Figure 14. PowerPoint Summary . (Stored in Report Path)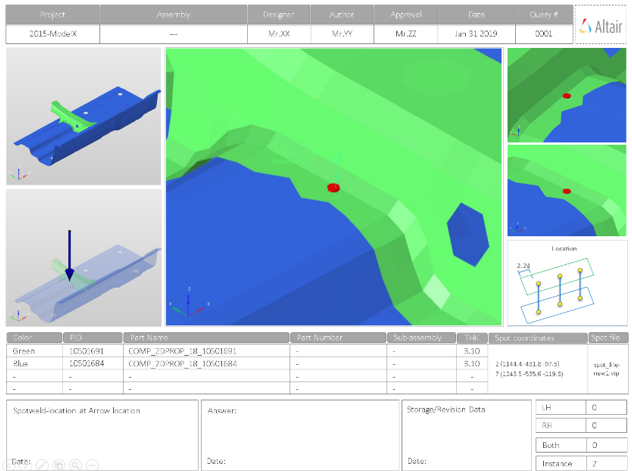
Figure 15. PowerPoint Detailed Report. (Stored in Report Path)
Output
Overview of the PowerPoint report generated from the Spot Weld check.
- Report Header
- Project name, assembly name, and slide number.
- Assembly Picture
- Image of the components that have spot weld issues.
- H3D Image
- Section can be viewed in the HyperView Player, and shows an H3D image shows the FE model with the spot weld marked with Cross Hairs.
- Issue Details
- Details of components which have spot weld issues.
- User Review Section
- Used to add additional information when exchanging information with designers/engineers.
- Additional Info
- Occurrences of the issue shown in the current slide. The number of instances show the number of occurrences of the issue.
Supported Spotweld Checks
Overview of the spotweld checks available to perform in the model.
- Closest
- Detects the spot welds which are too close to each other. The closeness
tolerance is used as the criteria for deciding if two spot welds are
considered as too close.
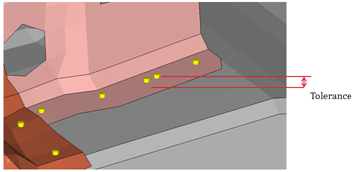
Figure 16. - Gap
- Detects the spot welds in which the distance between the spot weld
location and the connected components lie outside the given maximum and
minimum gap limits.
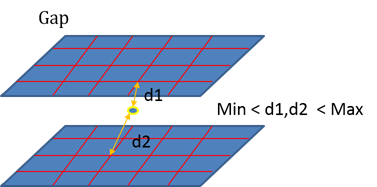
Figure 17. - Single Layer
- Detects the spot welds which are connected to only one part. The second
part is missing from the spot weld definition.
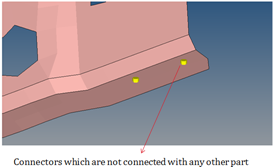
Figure 18. - Multiple Layers
- Detects the spot welds which are connected to more parts than what is
specified as the threshold number for multiple parts.
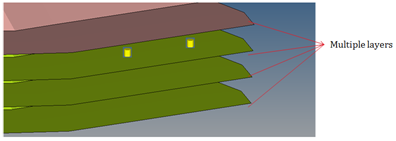
Figure 19. - HyperMesh Issues
- Detects the spot welds that failed during realization.
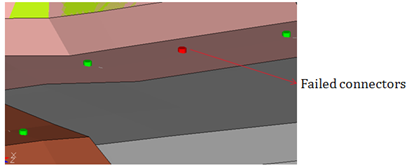
Figure 20. - Non-Parallel Flanges
- Detects the spot welds that are connecting the non-parallel flanges.
Flanges are said to be non-parallel if there is a gap or step of the
flanges diverge.
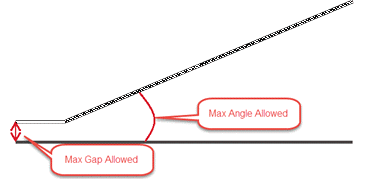
Figure 21. - Incorrect Location
- The Model Verifications creates feature lines internally to check the
distance between the connector and the feature line. When the distance
between the connector and feature line is less that the specified
tolerance, the location of the connector is said to be incorrect. The
feature angle used to create feature lines is specified in the
Feature Angle field.
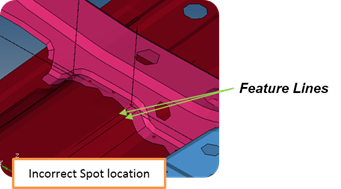
Figure 22. - Few Connections
- Detects the possible locations where the spot welds may be missing. This
detection is done based on the adjacent spot welds in that area.
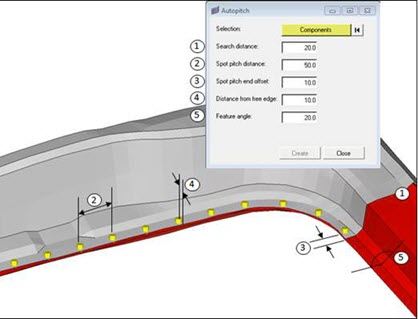
Figure 23. - Flange Gap
- Detects if the gap between the flanges is within the minimum and maximum
limit of the average of the component thicknesses being connected by the
weld.
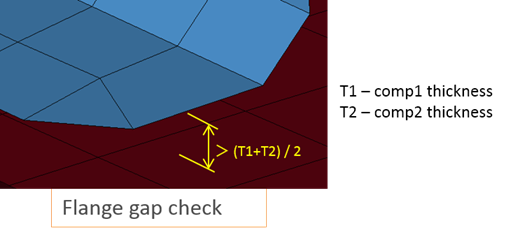
Figure 24. - Spotweld Intersection
- Detects if a spot weld has an intersection with an unconnected
component.
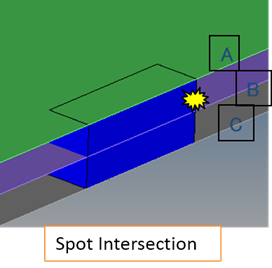
Figure 25. - Spotweld on Fillet
- Detects if any spot weld is located on fillet features.
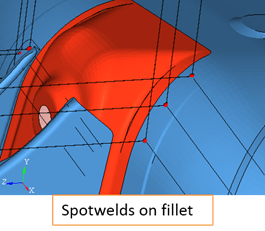
Figure 26. - Reflect Spotweld
- Detects if any spot weld can be realized on reflecting its location
about a plane defined by the user.
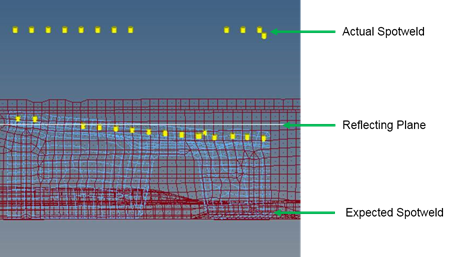
Figure 27.
Connection
Connection check detects problems with parts/components such as bolts, nuts, clips, plates and reports the problems in a PowerPoint file.
There are multiple checks that can be performed, depending on the selection, the tool perform the checks and results of the checks are written out to the report files.
-
Click the folder icon and navigate to the model to import (Folder/File
selections).
The folder or the selected location must contain the spot weld file. The spot weld file type must be set in the config file.
Figure 28. -
Click View Report to display the Summary PowerPoint
report.
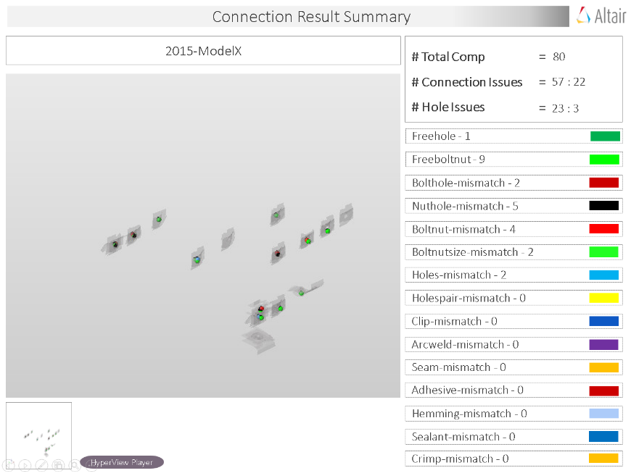
Figure 29. PowerPoint Summary . (Stored in Report Path)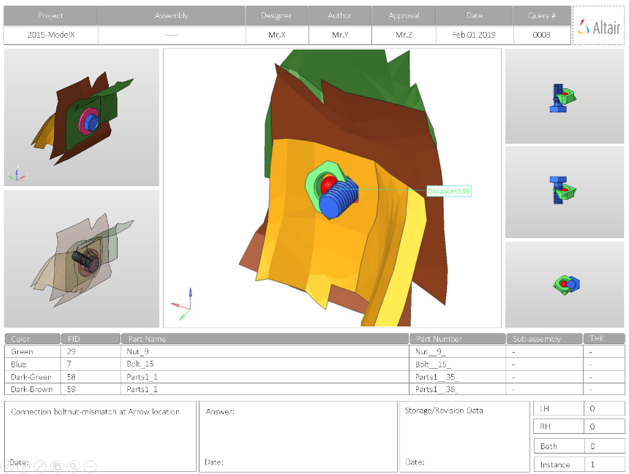
Figure 30. PowerPoint Detailed Report. (Stored in Report Path)
Output
Overview of the PowerPoint report generated from the Connection check.
- Report Header
- Project name, assembly name and slide number.
- Full Assembly Picture
- Image of the components that have connection issues.
- H3D Image
- Section can be viewed in the HyperView Player, and shows an H3D image shows the FE model with the connections marked with Cross Hairs.
- Issue Details
- Details of components which have connection issues.
- User Review Section
- Used to add additional information when exchanging information with designers/engineers.
- Additional Info
- Occurrences of the issue shown in the current slide. The number of instances show the number of occurrences of the issue.
Supported Connection Checks
Types of checks to perform on connections in the model.
- Free Hole
- Detects the holes in the model which do not have connectors around
them.

Figure 31. - Free Bolt-Nut
- Detects the bolts and nuts which do not have corresponding holes to fit
in.
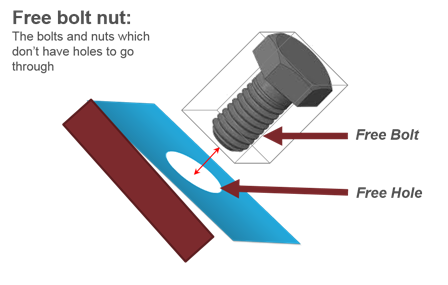
Figure 32. - Bolt Hole Mismatch
- Detects the bolts which have a hole around it, but the distance between
the bolt center and hole center is more than the threshold value.
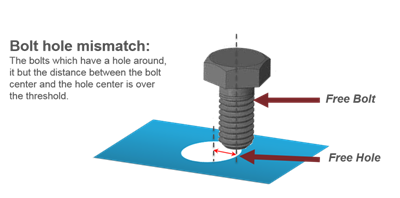
Figure 33. - Nut Hole Mismatch
- Detects the nuts which have a hole around it, but the distance between the nut center and the hole center is over the threshold.
- Bolt-Nut Mismatch
- Detects the bolt nut pairs whole location or alignment direction do not
match properly.
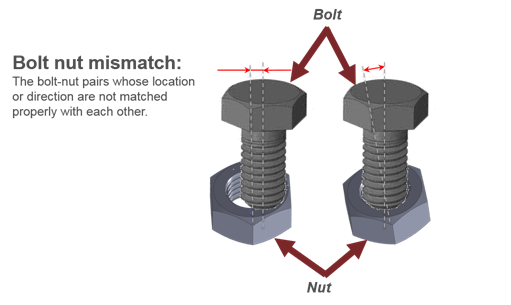
Figure 34. - Bolt-Nut Size Mismatch
- Detects the bolt nut pairs whose sizes are different from each other.
Note: The diameters of bolt, nut and clip are found through a CSV file.
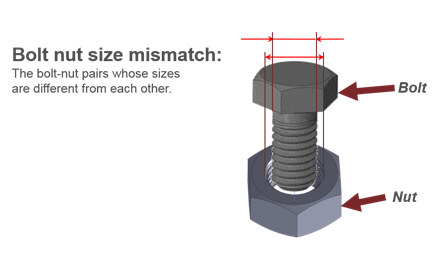
Figure 35. - Holes Mismatch
- Detects pairs of holes whose center axes do not match.
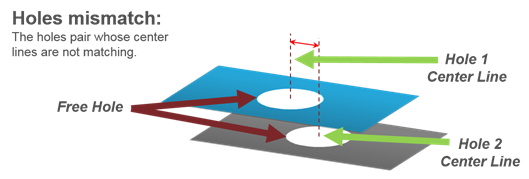
Figure 36. - Holes Pair Missing
- Detects the holes that do not have a corresponding pairing hole within
the specified tolerance.
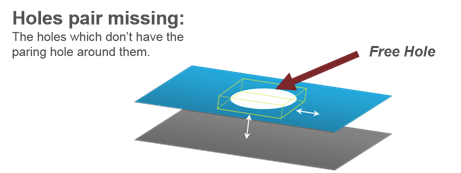
Figure 37. - Clip Mismatch
- Detects the clips which have a hole around it but the distance between the clip center and the hole center is over the threshold.
FreePart
FreePart check detects the components in a model that are not connected to any other component through ID connectors or shared nodes.
-
Click the folder icon and navigate to the model to import (Folder/File
selections).
The folder or the selected location must contain the spot weld file. The spot weld file type must be set in the config file.
Figure 38. -
Click View Report to display the Summary PowerPoint
report.
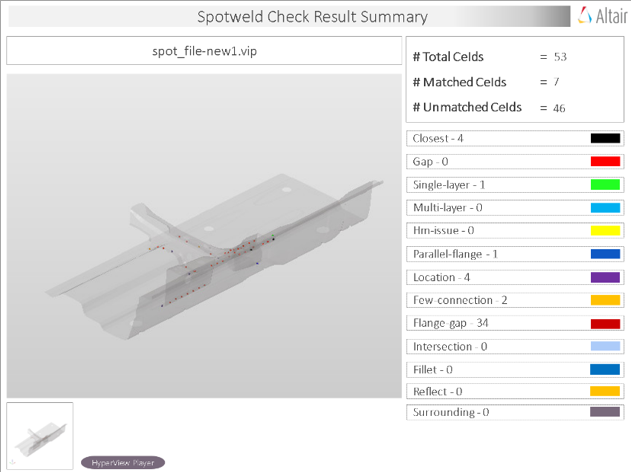
Figure 39. PowerPoint Summary and Detailed Report. (Stored in Report Path)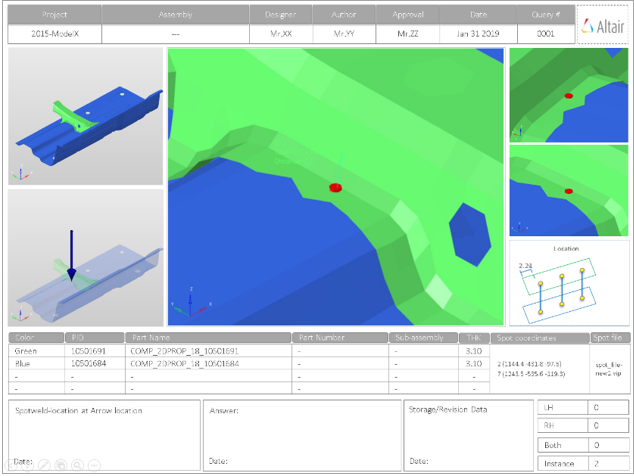
Figure 40. PowerPoint Detailed Report. (Stored in Report Path)
Output
Overview of the PowerPoint report generated from the FreePart check.
- Report Header
- Project name, assembly name, and slide number.
- Assembly Picture
- Image of the components that have free part issues.
- H3D Image
- Section can be viewed in the HyperView Player, and shows an H3D image shows the FE model with the free parts marked with Cross Hairs.
- Free Part Details
- Details of components which have free part issues.
- User Review Section
- Used to add additional information when exchanging information with designers/engineers.
Spot Comparison
Spot Comparison check compares two spot connector files using the Model Verification tool.
-
Click on the folder icon and navigate to the model to import (Folder/File
selections).
Figure 41. -
Click on the folder icon and navigate to the model to import (Folder/File
selections).
-
Click View Report to display the Summary PowerPoint
report.
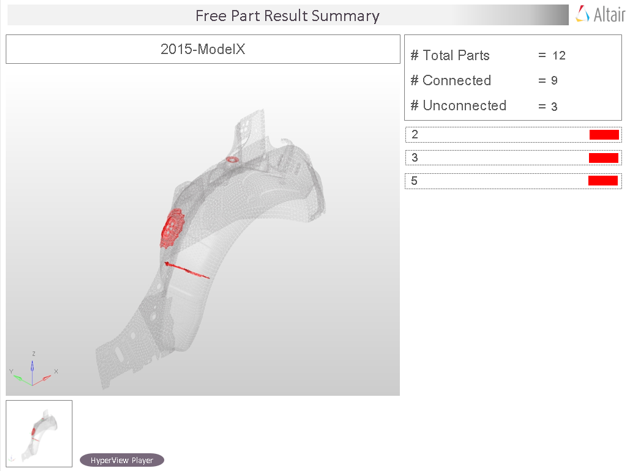
Figure 42. PowerPoint Summary Report. (Stored in Report Path)
CSV-Comparison
CSV comparison tool compares CAD/FE attributes against CSV file column.
Supported attributes are Part name, PID, Part Number, Material Name, Thickness, File name. It has 3 options, “compare”, “compare-update” and create “new XML”.
Multiple Checks
Multiple Checks perform multiple checks using single interface.
If Offset check is ON, CAD data will be offset using thickness value. Offset CAD data will be used to check all other checks. Check and Reports are sequentially executed for each check. Offset, Intersection, Spotweld, Connection, Free Part check uses Base Model selection alone and ignore Variant model selections. Comparison function uses both Base Model and Variant Model selections. Check items, input rules are as per individual checks explained in respective check functions.
-
Upload the variant model using the Variant Model(s) options.
- Select an import type.
- Select a data type.
- Navigate to the model to import.
Figure 43.