Visualize the representation of system reliability in the Reliability Plot post
processing tab.
From the Post Processing step, click the Reliability
Plot tab.
Using the Channel selector, select the channel(s) to plot.
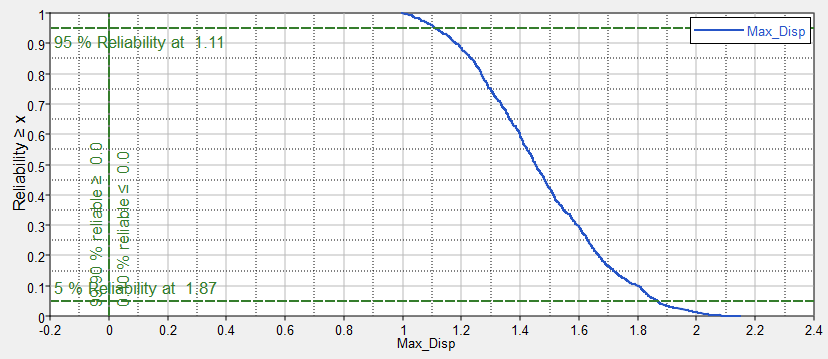
Analyze the plot.
The relationship between the desired threshold and the reliability of the system is
plotted.
Refer to the vertical axis to locate a desired reliability and find the corresponding
x-axis value of the curve to identify the required threshold. For example, "To have
95% reliability I would have to design this value." You can also find a threshold
from the x-axis and locate the corresponding reliability. For example, "91% of my
designs are below X value". The latter use case is more common. Figure 1.
Tip:Display selected data in a single
plot or separate plots by switching the Multiplot option between (single plot) and
(multiple
plots).
 (single plot) and
 (multiple
plots).
(multiple
plots).