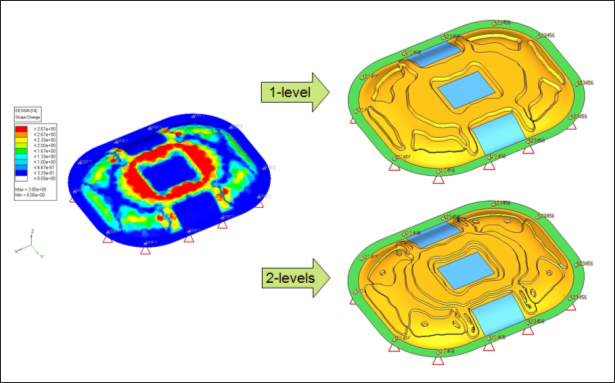
The autobead feature of OSSmooth allows OptiStruct
topography optimization results to be interpreted as one or two level beads.
Figure 1
shows the level of detail captured in both cases; while the 2-level approach captures more
details, it is more complicated to manufacture than the 1-level interpretation, often
without significant performance gain. Figure 1. Autobead Interpretation of Topography Optimization Result
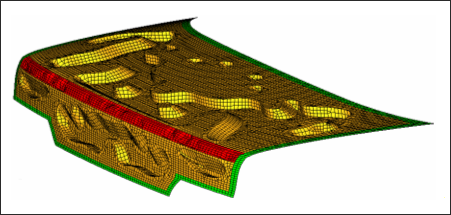
Example: Autobead Result from Topograph Optimizationn
Figure 2. Parameter File Figure 3. Autobead Result from Topography Optimization
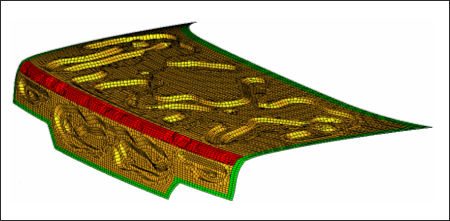
Example: 2-Layer Autobead Result from Topography Optimization
Some topography performances are relying on the half translation part. OSSmooth can
interpolate topography optimization results to 2-layer autobead (autobead third argument
2).