Evaluate
Run the model and view results.
Evaluate the Model
-
From the Run tools, click the Run Analysis tool.

Figure 1.The Evaluate dialog opens.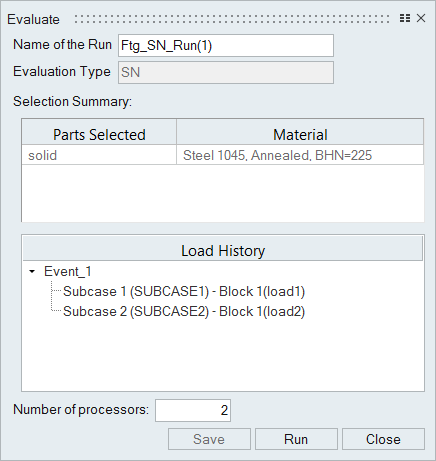
Figure 2. -
Click Run.
The Run Status dialog opens.
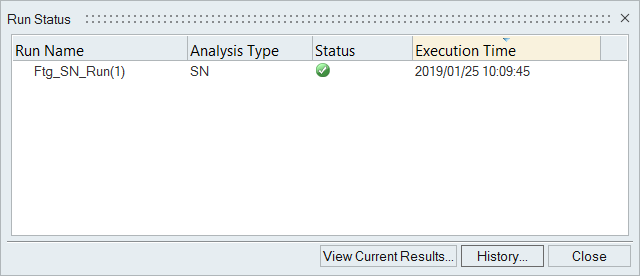
Figure 3.Note: If you do not assign any time history to an event, you are prompted about the missing channel when you click Run.The following result files are saved to C:\Documents\Fatigue\RunHistory by default, or the home directory defined in the preferences:- *.hlf - holds the options selected for the fatigue calculation
- *.hwascii - results file of the fatigue calculation
- *.RainflowOut - rainflow file of the most damaged element
Tip:
- If you have previously completed a run and would like to quickly view
results, click the Evaluate
tool.

Figure 4.
Visualize Results
-
From the Run Status dialog, select a run and click
View Current Results.
The Results Explorer is displayed.
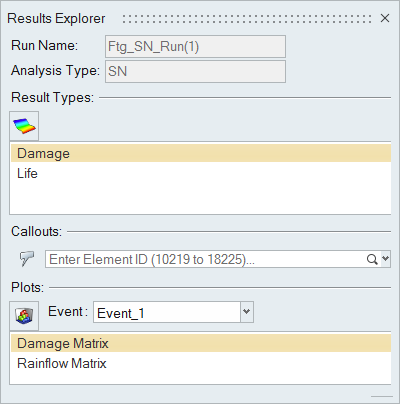
Figure 5. -
Click
 to toggle the display of
results.
to toggle the display of
results.
-
Review effected elements in the modeling window.
Note: A key on the left side of the modeling window color codes damage/life values depending on the result type you select. It also displays the values and IDs of the maximum and minimum elements.
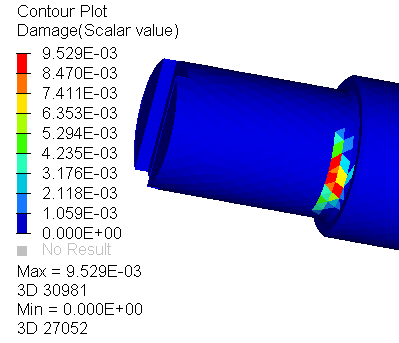
Figure 6. -
Review information for specific elements.
- Enter an element ID in the Callouts text box.
- Click
 and select elements in the
modeling window.Tip: Delete an element callout by right-clicking on an element ID and selecting Delete or Delete All.
and select elements in the
modeling window.Tip: Delete an element callout by right-clicking on an element ID and selecting Delete or Delete All.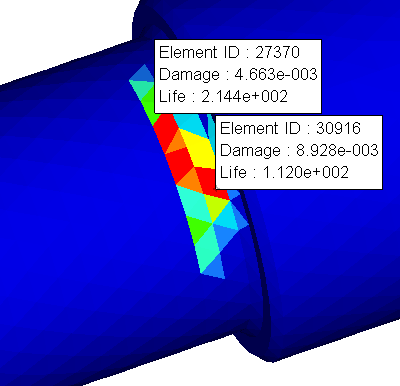
Figure 7.
-
Plot a matrix for specific elements and events by selecting an element in the
modeling window, choosing an event from the
drop-down menu, and defining a plot matrix type.
Tip: Click
 to
expand the matrix.
to
expand the matrix.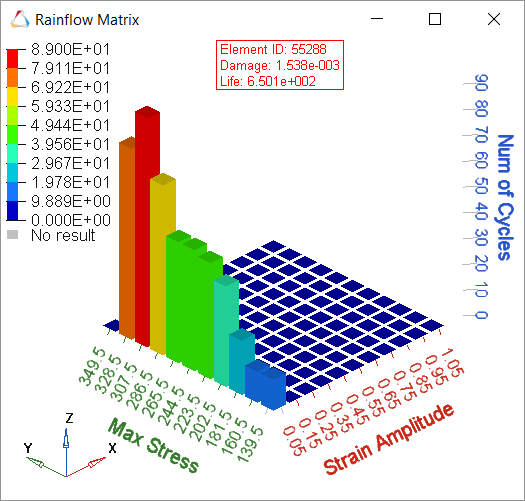
Figure 8.
View Run History and Run Status
-
To view all the fatigue evaluations saved in the home directory, click the
Run History satellite icon.

Figure 9.On Windows, the default home directory is C:\Documents\Fatigue\RunHistory.
On Linux, the default directory is /usr/tmp/Fatigue/RunHistory/.
The home directory can be changed from the preferences menu.
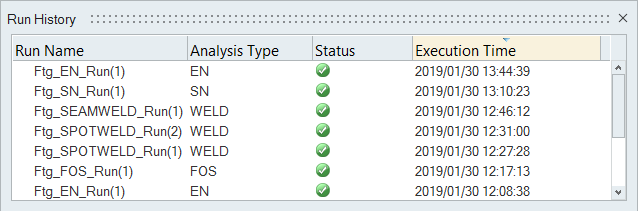
Figure 10. -
To view all the fatigue evaluations performed in the current active session,
click the Run Status satellite icon.

Figure 11.
Figure 12.Tip: You can also view run history by clicking History in this dialog.