Performance Metrics - HyperView
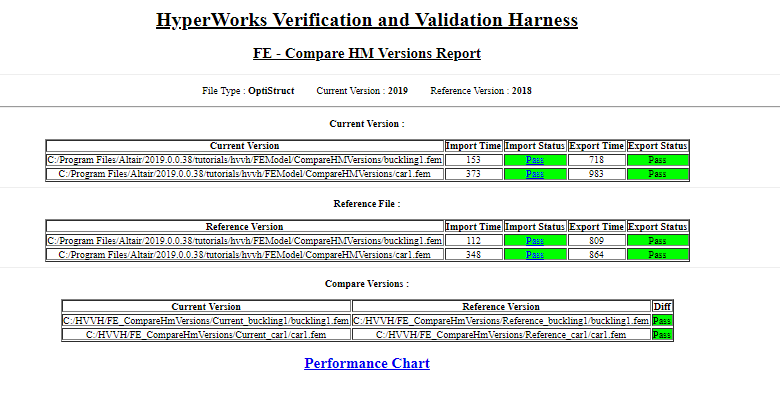
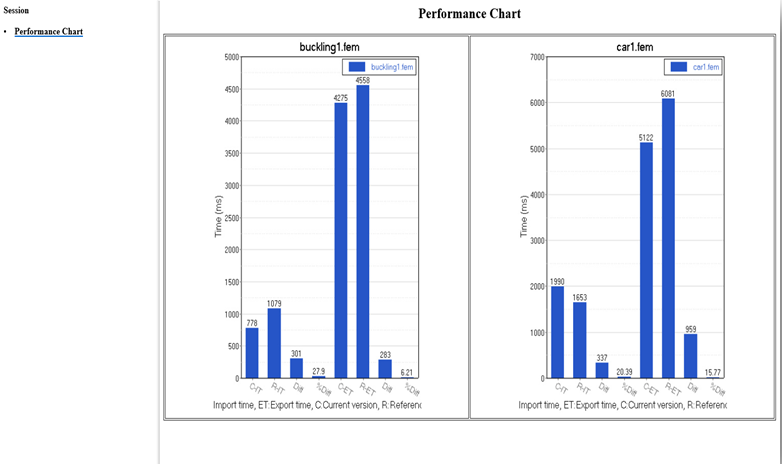
The actual time to import and export the solver decks across different HyperMesh versions are captured and available as a performance chart along with the difference in timing and percent change. This helps you assess the solver interfaces based on performance.